PostHog helps you understand how people use your website or application. It combines product analytics, session recordings and experiments, so you can find a problem, see its context and judge the effect of the changes you make.
PostHog: product analytics, session recordings and A/B tests
PostHog: from user data to product decisions
You can see traffic on your site, but you still don’t know why people abandon sign-up or never come back to the app? PostHog lets you analyse specific actions, replay selected sessions and check the effect of your changes. It brings together product analytics, session recordings, experiments and control over which features are switched on. Because everything shares the same user context, it is easy to move from a chart to the situation behind it.
It makes the most sense where you develop a product continuously: a SaaS application, an online store, a customer portal or a website that generates enquiries. At Okinet we can help you plan what to measure, connect it to your application and build reports that answer your team’s questions. The starting point is the decision you want to make, for example which step of sign-up most needs improving.
Events and product analytics: what users really do
Analysis is built on events, meaning recorded actions: creating an account, adding a product to the basket, paying for an order or using a particular feature. Event properties describe the context, such as the plan type or the device. You can compare groups of users and see how use of the product changes over time.
Autocapture makes it easy to collect supported interactions without manually describing every click. Key business events are still worth defining deliberately, though. Clicking “Pay” and a confirmed paid order are two different moments. The second is best tied to a reliable status from the payment system or the application.
During implementation we agree on event names, what they mean and how users are identified before and after they log in. We also check for duplicates and test traffic. Organising measurement this way keeps reports understandable as the site keeps changing.
Conversion funnels: find the step where you lose users
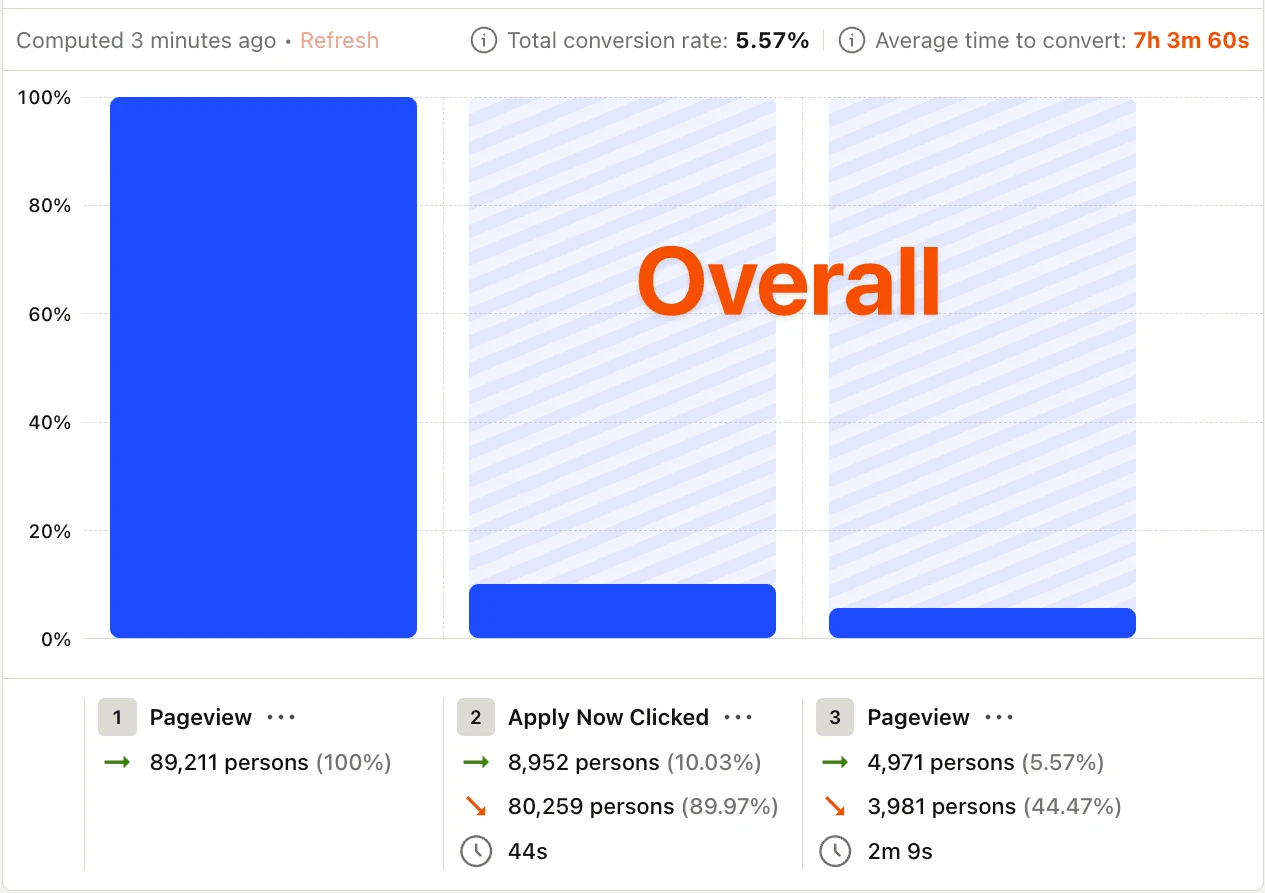
A funnel shows how people move through a set sequence of events. In a store this might be viewing a product, adding it to the basket, starting checkout and completing the purchase. In an application: sign-up, account setup and finishing the first task. PostHog shows the conversion between steps and how long it takes to complete them.
Breaking results down by device, traffic source or any other collected property helps narrow the problem down. If drop-off happens mainly on phones, you can look at the mobile form and the matching sessions. The chart alone shows where you lose people; the cause still needs to be confirmed.
The definitions of the steps, the allowed order and the time window all matter. Without them, two reports on the same process can show different results. In the illustration below, the bars are relative to the number of people at the first step of the funnel.
Retention and cohorts: check whether users come back
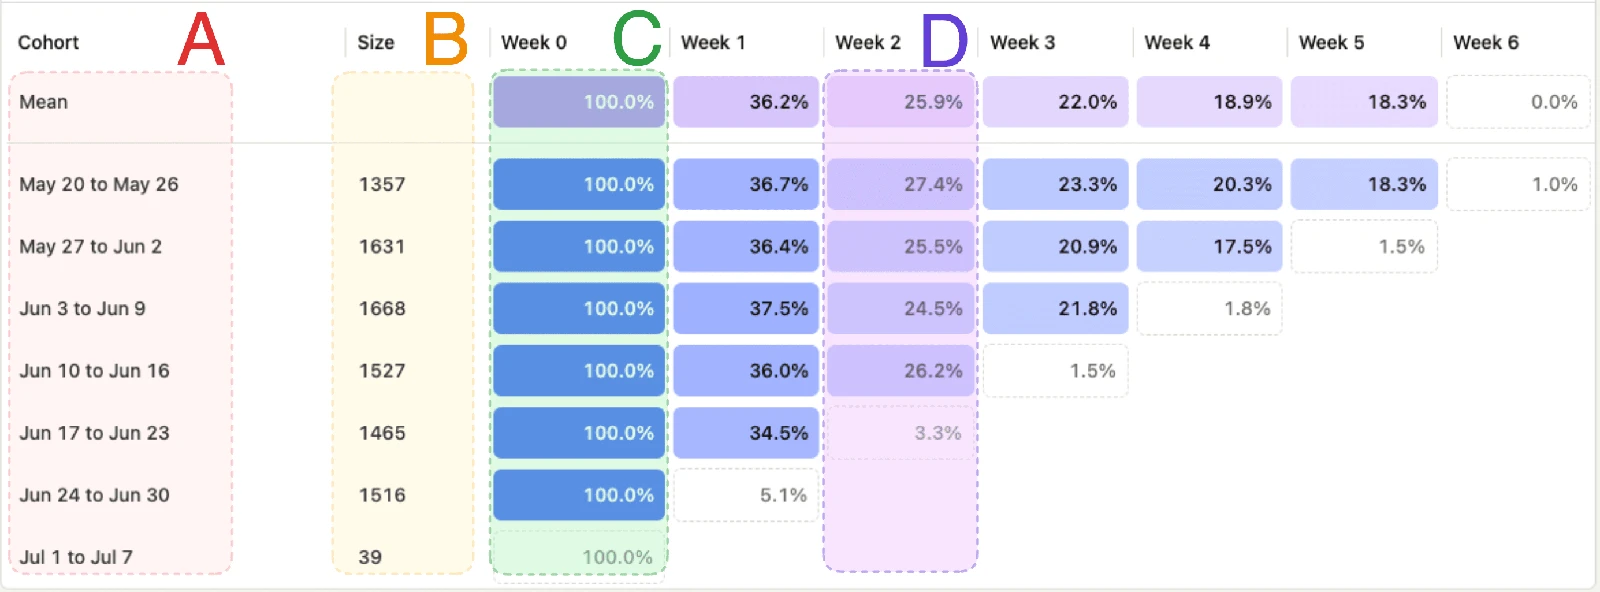
Getting someone to create an account is only the start of their relationship with the product. A retention report shows what share of users come back and perform a given action in later periods. You choose the starting event and the return event yourself: for example, creating a first project and then using it again later.
Cohorts let you analyse groups that share a trait or behaviour. You can compare people who completed onboarding with those who dropped out of it. A difference like this is a lead for further analysis, not automatic proof that onboarding caused the improvement.
Read the table with the age of each group in mind. Users who joined last week don’t yet have six weeks of history. Incomplete periods shouldn’t be compared directly with finished ones. In the illustration, each row is a group from a different week, and the columns show the periods since observation began.
Session Replay: see how a session unfolded and the context of a problem
Session recordings help you understand situations that a conversion rate alone cannot explain. You can see the screens, the clicks and how the interface responded, and then match them with events. This is useful when looking for problems with a form, navigation or a newly released feature.
Session Replay rebuilds the recorded state of the interface and its changes; it isn’t a video of the user’s whole computer. What data is captured depends on the configuration. With the right setup you also get technical context, such as errors or console output.
Rather than watching random sessions, start with a specific segment: people who got stuck at a particular step, or sessions linked to an error. Choosing a sample and setting recording rules keeps down the amount of material your team has to review.
Feature flags: release features in stages
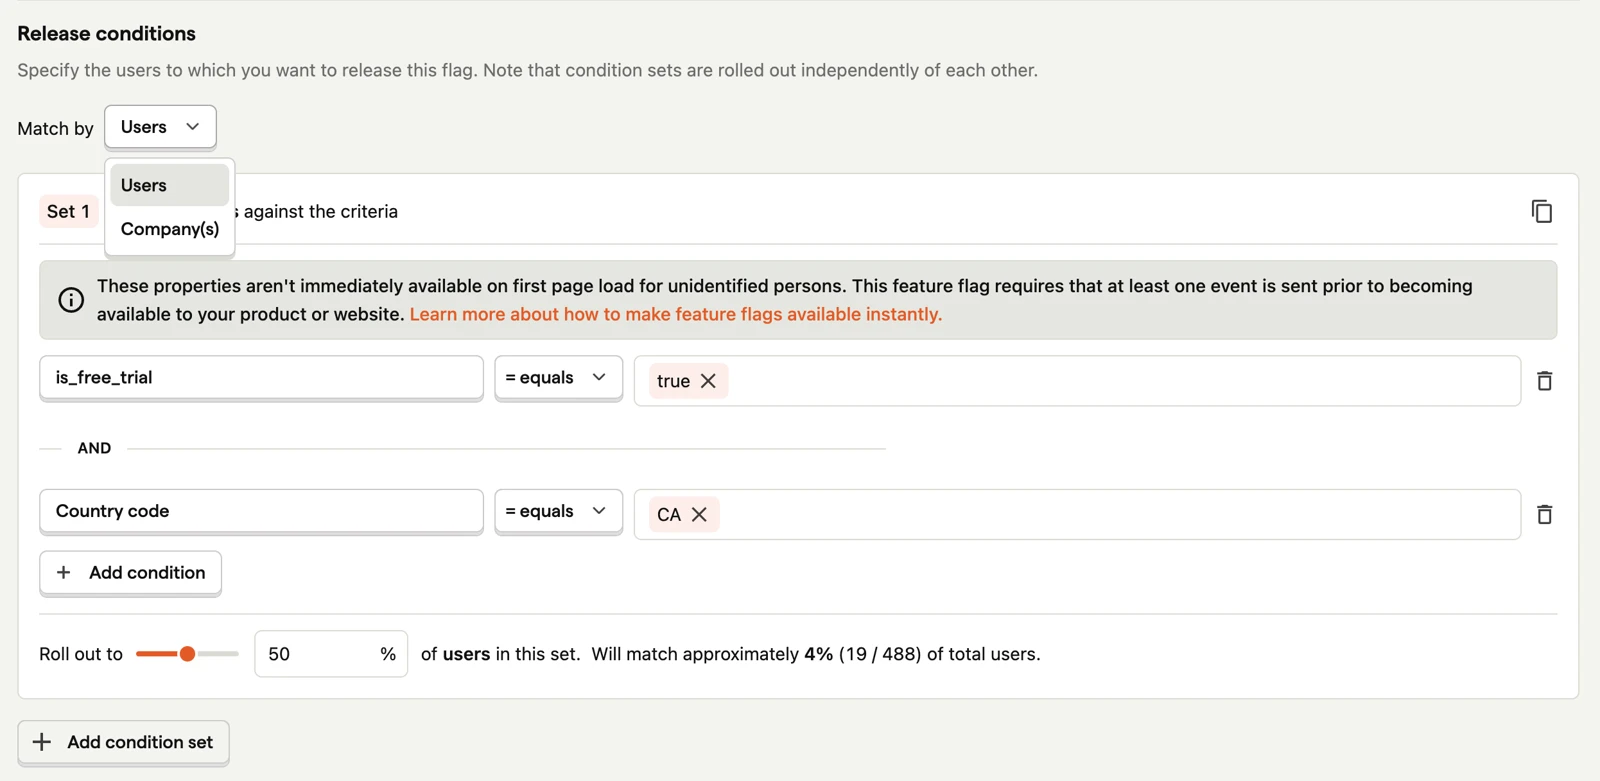
A feature flag is a switch that the application checks before showing a particular feature or variant. Once this check is built into the code, you can change who sees the feature from within PostHog. This separates deploying code from the moment users actually see the change.
You can release a new checkout process to your team first, then to a selected group, and only later to a wider audience. Conditions can use user properties and a percentage of the group. In the vendor’s example, the rule combines a trial period, a country and the share of users included in the change.
A flag needs a planned default behaviour, including for when the application can’t fetch its value. It doesn’t replace permission checks on the server. Once a rollout is finished, it is worth removing flags you no longer need, along with the code branches that go with them.
A/B experiments: judge a change against a clear goal
PostHog Experiments lets you compare product variants against defined metrics. You can check whether a shorter form helps more people finish sign-up, or whether new onboarding helps users start using their first feature. Feature flags deliver the variants, and event tracking supplies the data to evaluate them.
Before you start, you set a hypothesis, the audience, the main metric and the measures you don’t want to get worse. More submitted forms doesn’t necessarily mean more valuable enquiries, so it is worth including a later stage of the process too.
Reliable interpretation needs enough observations and enough time. With low traffic, the result may stay inconclusive for a long time. An experiment gives you a basis for a decision, but it doesn’t guarantee that you will find a better variant.
Surveys and web analytics: combine behaviour with feedback
In-product surveys let you collect answers while people are using the application. After a process is complete, you can ask how difficult the task was, and after someone uses a new feature, how useful it is. A short question tied to a specific moment usually gives your team more useful material than a general request for feedback.
Web Analytics fills in the picture with site traffic: pages visited, traffic sources and campaign context. This means you can start from where your audience comes from and then analyse what they do next. You choose the scope of both modules to suit your needs; there’s no need to switch on every feature of the platform at once.
Error Tracking: find out which errors affect users
Error Tracking collects and groups application errors, helping you boil repeated reports down to the problems that need diagnosing. Linking an error to a user and an available session recording gives your team context: what happened before the failure and which process was interrupted.
This makes it easier to set priorities. An error that blocks purchases may need a different response from a problem in a rarely used screen. Implementation should include checking what data is sent and making sure the report actually lets you trace the problem back to its source in the code.
Data Warehouse: connect product usage with business data
Behavioural analytics becomes more valuable when combined with payments, subscriptions or information from other systems. The Data Warehouse module lets you connect supported sources and analyse the data, including with SQL. This lets you look for links between feature usage and customers keeping a paid subscription.
Connecting data like this requires consistent identifiers and agreement on what each metric means. Sign-up date, trial start and first payment describe different moments. We tidy up these definitions first and then build the report. Simply having the data in one tool doesn’t resolve discrepancies between systems.
AI Observability: keep track of features built on AI models
If your application uses language models, PostHog can help you monitor calls, response times, token usage and costs. The context of calls and execution traces makes it easier to analyse more complex flows, such as an assistant that uses tools.
You can see which tasks cost the most and where users wait the longest. However, this kind of monitoring doesn’t tell you whether the model’s answers are correct. Quality needs a separate evaluation. Before collecting the content of prompts and responses, you also need to decide which information should be left out or masked.
Privacy, data masking and choice of hosting
We plan the scope of measurement together with the scope of the product. With Session Replay, it is especially important to mask fields and content that shouldn’t leave the browser. Event properties, URLs and any other collected data need a separate review: masking recordings doesn’t replace checking the whole integration.
PostHog offers cloud hosting in an EU region. Choosing the region is one part of organising data processing; on its own, it doesn’t settle your obligations around consent, user information or retention rules. The tool’s configuration has to match the policies adopted for the site.
You can also run PostHog yourself, but the vendor describes self-hosting as an option without official support. That means you are responsible for updates, security and maintaining the infrastructure. If you choose this route, you need to assess which features are available and the real cost of looking after the system.
Implementing PostHog on a website, store or application
Integration should cover both the interface and the business events that originate on the server. In a project built on Vue.js, we can plan tracking of navigation and interactions in the application. In a system using PHP and Symfony, we can send confirmed process events. For a WordPress site, a good starting point is forms and the main contact paths.
It is worth rolling out in stages: first the business questions and an event plan, then integration, data checks and a few reports. Only once the measurement quality is confirmed do we add recordings, experiments or further data sources. We also check how the scripts affect site performance.
If you already use GA4, PostHog can run alongside it. First we agree which questions each tool should answer and how to interpret differences in the results. Different identification rules, filters or measurement scopes can mean the numbers won’t match exactly.
PostHog costs and a sensible scope to start with
PostHog offers free allowances and usage-based billing for each product. Costs therefore need to be weighed against your expected volume: events, recordings and the other features you use. Current rates and terms are best checked in the vendor’s pricing page.
When estimating the budget, we also include integration, maintaining the measurement and the time needed for analysis. Cutting unnecessary events and choosing sensibly which sessions to record helps focus resources on the data you actually use.
To begin with, one key process, well-described events and a report that points to a problem to solve are often enough. Let’s talk about measurement on your website or application: together we will work out where PostHog can help and what scope of implementation makes sense.