Zabbix helps you keep an eye on servers, networks, applications and services. It collects measurements, shows how they change over time and alerts you to problems, so your team has the data it needs to diagnose issues and respond.
Zabbix: monitoring for infrastructure, applications and services
Monitoring that helps you respond to problems
When an online store stops taking orders, a “site unavailable” message alone doesn’t explain why. The problem could lie with the server, the database, the network or a service the application depends on. Zabbix collects measurements from all of these and lets you set the conditions under which your team gets notified.
You can use it to watch over a single website, an application environment or infrastructure spread across many locations. At Okinet we can help match the scope of monitoring to the processes that matter to your business. We start by agreeing what should be working, how to recognise a problem and who should respond to it.
Linux and Windows servers: load, memory, disks and processes
Zabbix lets you track CPU, memory and disk usage, as well as the state of processes and services. Measurement history makes it easy to see whether a spike in load was a one-off or recurs during product imports, report generation or backups.
Data can reach the system through an agent installed on the monitored server. There are also agentless methods, depending on the service being checked. We choose them so that you get the information you need with the right level of permissions.
We tune alert thresholds to the environment. A brief CPU spike doesn’t always need action, but running out of disk space can quickly stop data from being saved. Both the measured value and how long the unwanted state lasts are important.
Networks and devices: find out where connectivity breaks
Switches, routers and other devices expose data that can be collected over SNMP. Zabbix can check things like interface status, traffic and transmission errors, as long as the device exposes the relevant metrics. ICMP and TCP checks also help confirm that hosts and selected services are reachable.
Combining these measurements makes it easier to tell an application failure from a connection problem. Where the check runs from also matters for diagnosis: a service that is reachable from the local network may still be unavailable to people on the internet. That’s why we place measurement points along the route your users actually take.
Databases, applications and integrations: monitor key dependencies
The official Zabbix integrations catalogue includes templates for many databases, web servers and cloud services. A template describes how to collect data and includes ready-made rules, but you still need to configure the connection and check compatibility with the version you use. Installing Zabbix doesn’t automatically start monitoring every system.
In a project built on PHP and Symfony, we can also add measurements for the job queue, the time of the last successful sync or the number of failed operations. Signals like these help catch situations where the site still loads but the back end has stopped doing important work.
For a store or website on WordPress, it is worth including the database and scheduled tasks too. For example, stock levels that have stopped updating may matter more to the business than a small change in server load. Measuring this properly requires the application or integration to expose that information.
Website and API monitoring: an HTTP response is only the start
Web scenarios let you run a series of HTTP and HTTPS requests at regular intervals. Zabbix measures response time, checks response codes and can look for required content. This verifies that the site returns the expected result, rather than just checking that a network port is open.
You can set up a scenario with several steps, such as opening a page and downloading a particular resource. For an API, we agree separately how to recognise a response that is correct from a business point of view. A 200 status isn’t enough if the content contains an error or out-of-date data.
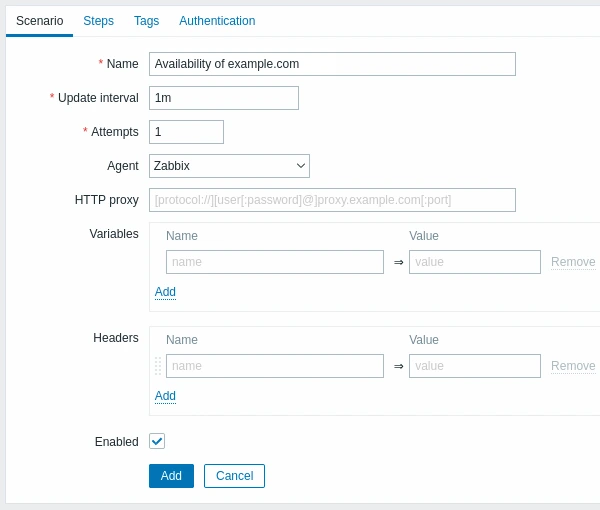
The example below shows the scenario settings: name, frequency and number of attempts. The actual requests are defined in its steps. We choose how often to run checks based on how important the service is and the cost of running the tests.
Browser monitoring: test a chosen user journey
For processes that rely on JavaScript, Zabbix also offers Browser items. These run prepared scenarios through WebDriver, collect measurements and take screenshots. They need an additional browser environment and a script that describes the test.
This way you can check whether a form opens, whether logging in works on a test account or whether an expected element of the application appears. It is a different level of verification from simply downloading an HTML document. The scenario must be updated alongside changes to the interface, and any operations that save data should be run in a controlled way.
Synthetic monitoring checks a defined path under specific conditions. It doesn’t show everything real users do and doesn’t replace testing the whole application. What it does give you is a repeatable signal of whether a chosen process still works.
Alerts and escalation: the message should reach the right person
In Zabbix, a problem detection rule, called a trigger, evaluates the collected data. An action defines what should happen once the conditions are met. A notification can go to chosen recipients through a configured channel, and further escalation steps can depend on time and on how the problem is being handled.
A good message should name the service, the symptom, when it started and the first diagnostic step. We also agree which events need a quick response and which can wait. A separate message when service is restored helps close the incident.
We test notifications together with the people who receive them. It is worth checking the whole flow: detecting the problem, delivering the message, the response and the return to normal. Lots of similar alerts without a clear owner make work harder, even if the measurement itself is working correctly.
Dashboards and maps: put measurements in the context of your infrastructure
A dashboard lets you bring together charts, current values and a list of problems. A map shows how parts of the infrastructure connect and what state they are in. This helps whoever is diagnosing a failure find the devices and services linked to the part of the system that is down.
We tailor the view to the audience. An administrator needs detailed metrics, while the person responsible for running the store needs clear information about key services. A few well-chosen indicators are often more useful than a screen filled with every available chart.
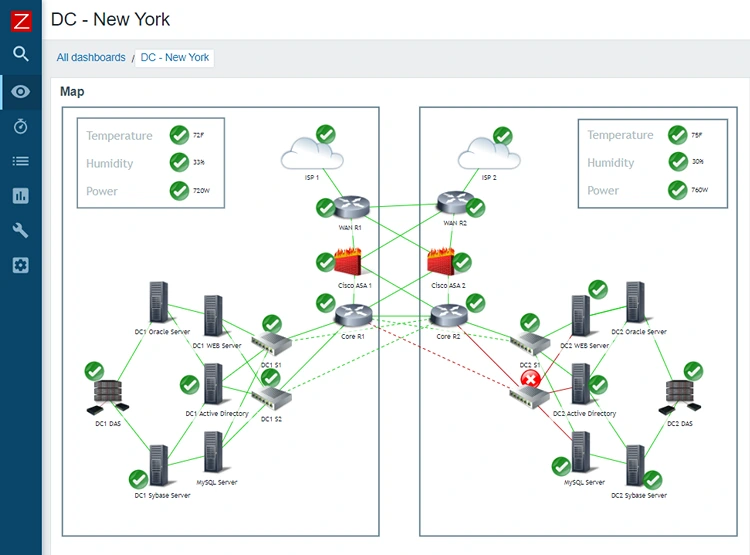
The illustration shows part of an example dashboard from the vendor with a data centre map. It is presentation material from the interface shown in 2023; the layout of a current installation depends on the version and configuration.
Zabbix Proxy: monitoring multiple locations
A proxy collects data close to the monitored devices and passes it on to the main Zabbix server. It is useful in branch offices, separate networks or environments with limited connectivity. A local buffer keeps measurements during a temporary loss of connection, within the configured retention period and available resources.
The split of responsibilities is important: the proxy collects and pre-processes data, while the main server evaluates triggers and handles alerts. So keeping measurements in the buffer doesn’t mean notifications will be sent in real time while the connection to the server is down.
We design the architecture around the number of locations, the reliability of connections and how important the services are. As well as the monitored devices, you need to watch the proxies themselves and any delays in data delivery. A lack of new measurements should show up as a problem, not as false reassurance that everything is fine.
Services and SLAs: judge availability from a business perspective
Service monitoring lets you link technical problems to a service such as an online store, a customer portal or an ordering system. Zabbix lets you build a hierarchy of dependencies and rules that decide when a problem with one component affects the state of the whole service.
On this basis you can calculate availability figures and produce SLA reports. First, though, you need to agree on what availability means, the service hours and how planned downtime is counted. The report reflects the configured model and the available measurements; it isn’t automatic proof that every clause of a contract has been met.
This is useful when discussing the quality of maintenance. Instead of judging a system only by the number of alerts, you can see how incidents affected the functions that matter to your users.
Templates and automatic resource discovery
Templates help you apply the same measurement definitions, problem rules and charts to many hosts. A change to the shared configuration can then cover a whole group of similar devices. Settings specific to a particular environment have to be set separately.
Discovery features make it easier to bring further elements under monitoring, such as file systems or network interfaces. In a larger environment, this reduces the need to add similar measurements by hand. Discovery rules do need filters and checks, though, so that you don’t collect data about items you have no intention of maintaining.
During implementation we tidy up host names, groups and who is responsible for which services. This makes it easier to expand monitoring later and to hand over care of the infrastructure between team members.
Keeping monitoring itself available, and what it costs
Monitoring needs maintaining too. Zabbix offers a high availability mechanism for the server, with one active node and standby nodes ready to take over. On its own, it doesn’t make the database, the web interface or every network connection highly available. These parts need to be covered in the design and in recovery tests.
Zabbix software is available with no licence fees; since version 7.0 it has been released under the AGPLv3 licence. The terms are described on the official licence page. The implementation budget, however, covers infrastructure, configuration, updates and the time of the people who respond to alerts.
The size of the environment doesn’t depend only on the number of servers. The number of metrics, how often they are read, how long history is kept and the type of tests run all matter. That’s why we agree the scope and data retention before sizing the resources.
How we can implement Zabbix in your environment
We start by choosing the services whose downtime most disrupts your business. For each one, we define the signs that it is working properly, the data sources and the person responsible for responding. Then we choose templates, add any missing measurements and set up notifications.
Going live includes checking alerts against controlled examples of problems. Once the first data comes in, we can adjust thresholds, test frequency and what the dashboards show. Monitoring grows with the application: a new integration or a change in architecture may need new rules.
Let’s talk about monitoring your infrastructure. We can start with your most important service and plan the next steps based on what really needs watching.